Conservation Practices
Once the crop schedule and operations have been added, click the Continue button at the top of the Operations page. This will advance to the Conservation Practices page. On this page users will indicate the structural conservation practices that are in place on the field. If no conservation practices are in place on the field, simply click Save and Continue at the bottom of the Conservation Practices page which will return the user to the Management Scenario page. Alternately, users may navigate directly to the Management Scenario page using the left hand navigation links.
Add a Conservation Practice
To add a conservation practice, click the check box in the Select column of the conservation practice you wish to add. Users may add more than one conservation practice to a field, though some conservation practices are mutually exclusive. (See Mutually Exclusive Conservation Practices for more details.) The conservation practices are organized by groups, and the user may select the specific practice they are interested in adding. To add the conservation practice, expand the particular group by clicking the check box in the select column. Once the conservation practice group is selected, select the specific option within the group that you wish to add and fill in any required fields.
Mutually Exclusive Conservation Practices
To add a field/scenario or subproject to run, select either Add Subproject to Run or Add Field/Scenario to Run. The particular button that will be available will depend on the selection that you made under the heading Select Type. Once you have added all of the fields/scenarios or subprojects, it is time to simulate. The fields/scenarios or subprojects that you added will be displayed on the page, as shown below:
Autoirrigation and Autofertigation
Grass Buffer and Forest Buffer
Grassed Waterways and Grass/Forest Buffers
Contour Buffer and Grass/Forest Buffers
Conservation Practice Descriptions
Below are the descriptions of the conservation practices that are available in NTT.
Autoirrigation and Autofertigation
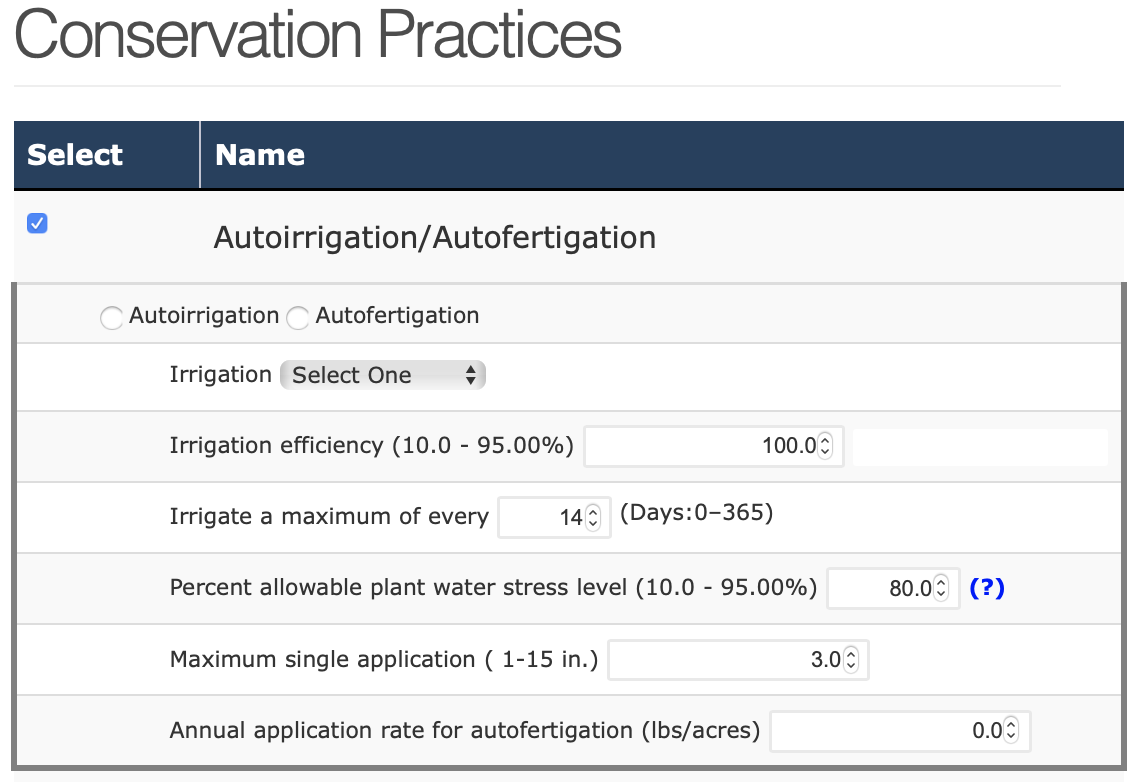
Autoirrigation
Autoirrigation refers to automatic irrigation systems, which are irrigation systems that are controlled by a computerized controller. Autoirrigation overall can greatly increase crop yield. Within NTT, the autoirrigation feature will irrigate the field when certain user-supplied criteria for water stress and frequency are met, and will limit water application to the user supplied maximum application amount. User inputs required for auto irrigation include:
Irrigation Type: Irrigation types include Sprinkler, Furrow/Flood, Drip, and Furrow Diking.
Irrigation Efficiency: This value is the fraction of irrigation application that is not lost to runoff. This must be a value that is greater than .10 and less than or equal to .95. The closer the value is to .10, the greater the percentage of water lost to runoff and does not reach the crop. A value of .95 means that no water was lost to runoff. Different irrigation systems have different irrigation efficiencies. NTT supplies typical irrigation efficiency values for the irrigation type selected, but these values can be modified by the user.
Irrigate a Maximum of every (0-365) days: This field is asking for the maximum frequency (in days) that irrigation can take place. If the frequency is set to 1, then irrigation can occur every day. If frequency is set to 7 then irrigation can occur, at most, once a week. The value can be any whole number greater than or equal to zero and less than or equal to 365.
Percent Allowable Plant Water Stress Factor: The water stress factor indicates the water stress level of the crop. This is the value that is used to trigger the start of auto irrigation. For example, if water stress is set to .80 then NTT will trigger an irrigation event when the crop is 80% water-stressed, as long as conditions for maximum frequency are also met. The plant water stress factor can be any value equal or greater than .10 and less than or equal to .95. The closer the value is to .95, the less water stress is allowed before the automatic irrigation is turned on.
Maximum Single Application: This value signifies the maximum amount of water than can be applied in a single irrigation event. It is in inches, and it can be any number greater than 0 and less than or equal to 15. If there are no constraints on the maximum single application, this value should be set to a high number.
Autofertigation
Autofertigation is the application of fertilizers, soil amendments, or other water-soluble products through an autoirrigation system. Autofertigation is an automatic fertilization process in which fertilizer is dissolved and distributed through the irrigation system. This makes autofertigation very similar to autoirrigation with the only additional user input required being Annual Application Rate For Autofertigation.
Annual N Application Rate For Autofertigation (lbs/acres): Maximum amount of fertilizer allow to applied in a single year.
Note: Nutrients applied through autofertigation are in addition to the nutrients from commercial and manure fertilizers that are applied to the crop (as part of the fertilizer operations). If you spray-irrigate manure on your field periodically it is best to represent this as a manure application and not through the autofertigation feature.
Tile Drain
Tile drainage is a practice for removing excess subsurface water from agricultural soils using perforated pipes. Drainage brings excessive soil moisture levels down for optimal crop growth. Tile drainage is often the best recourse for reducing high subsurface water levels to improve crop yields. Too much subsurface water can be counterproductive to agriculture by preventing root development, and inhibiting the growth of crops. Excessive water also can limit access to the land, particularly by farm machinery.
For NTT applications, underground drainage systems are simulated in APEX. The depth of the drainage system to reduce plant stress is a key parameter used in simulating tile drainage systems in NTT. Tile drainage simulation in NTT increases subsurface flow, which may provide an avenue for increased nutrient losses in subsurface flow. The only input for tile drains is depth. There are checkboxes for Tile Bioreactors and Drainage Water Management, respectively, which are part of the tile drain management System.
Depth: This is the depth in feet at which the drainage system is installed. It is any number greater than 0.
Wetlands
Wetlands are those areas that are inundated or saturated by surface or groundwater at a frequency and duration sufficient to support, and that under normal circumstances do support, a prevalence of vegetation typically adapted for life in saturated soil conditions. Wetlands generally include swamps, marshes, bogs and similar areas.
The wetland area is simulated as a shallow reservoir (1 ft. depth) with growing wetland vegetation – it is essentially simulated as an artificial wetland and not a natural wetland. The slope of wetland area is set as 1%. Simulated wetlands trap sediment, reduce runoff, increase infiltration, and also increase uptake of water and nutrients by the vegetation in the area covered by the wetland. Inputs required for wetlands include:
Area: The area of the wetland is input in acres. Since this area is no longer able to be used for crop production, there may be a lower total crop yield (although there may be a greater crop yield/acre).
Is wetland area included in your AOI?: Users indicate here whether the AOI representing the field includes the wetland feature within the drawn polygon or if the wetland feature lies outside of the AOI. If the wetland feature is included in the AOI, then the wetland acres will be subtracted from the field area.
Ponds/Water and Sediment Control Basins
Water and sediment control basins (WASCOBs), or ponds, consist of an embankment across the slope of a field or minor waterway to temporarily detain and release water through a piped outlet or through infiltration. They are constructed perpendicular to the flow direction and parallel to each other. WASCOBs are usually installed in areas where the land is relatively steep and undulating. They detain water from contributing areas, inducing sedimentation and controlling the release of water, thereby reducing the erosive power of the water downstream. Additional benefits are settling of sediment-bound pollutants and some infiltration. Only one input is required for ponds: fraction of area controlled by ponds.
Fraction of Area Controlled by Ponds/WASCB: This is the fraction (a value between 0 and 1) of the field runoff that flows through (is controlled by) the pond/WASCOB. As modeled, ponds only treat runoff that originates in this field. Inflow from other fields is not routed through the ponds. Ponds/WASCOBs are assumed to be within field.
Grass Buffer/Forest Buffer
Forest Buffer
Forest buffers are linear wooded areas with well-developed root systems, an organic surface layer, and understory vegetation. When they are adjacent to open water they are referred to as riparian forest buffers. Non-riparian buffers are linear wooded areas along down-slope field edges. Forest buffers trap sediment and increase infiltration, thereby reducing sediment and nutrient losses. Forest buffers often include a grass buffer between the field and the forested buffer. If present, please also include the width of the grass buffer.
The inputs for Forest Buffer are the following:
Area (ac.): This is the total area of the Riparian Buffer. This field is optional. If left blank, the area will automatically be calculated using the width of the buffer and the length of the field edge (where the field edge is calculated as the square root of the area of the field).
Grass Strip Width (ft.): This is the width of the grass strip between the crop and the forested buffer, if present.
Forest Strip Width (ft.): This is the width of the forest buffer (not including the grass strip).
Fraction of field treated by buffer: This is the estimated fraction (0.00-1.00) of the runoff from the field that is routed through the buffer.
Is buffer included in AOI?: If buffer has been drawn as part of the AOI, then the area will be subtracted from the crop area. If it has not been drawn as part of the AOI, it will be assumed to be adjacent to one edge of the field.
Grass Buffer
Grass buffers, also known as a filter strips, are an area of vegetation, generally narrow in width and long across the downslope edge of a field, that slows the rate of runoff, allowing sediments, organic matter, and other pollutants that are being conveyed by the water to be removed by settling out. Filter strips reduce erosion and the accompanying sediment-bound pollution.
In NTT, filter strips function by providing for better infiltration of soluble nutrients, trapping of sediment, and increased uptake of water and nutrients by the filter strip vegetation. The saturated conductivity value is also modified for filter strip simulation in NTT.
The inputs for grass buffers are the same as for forest buffers (see Forest Buffer), with the additional requirement that the user specify type of vegetation.
Vegetation: This is the type of grass or vegetation that is planted in the Filter Strip.
Grass Waterway
A grassed waterway is a natural or constructed swale, shaped or graded and established in suitable vegetation for the safe conveyance of runoff. Grassed waterways are designed to prevent soil erosion while draining runoff water from adjacent cropland. As water travels down the waterway, the grass vegetation prevents erosion that would otherwise result from concentrated flows and uptakes nutrients. Grassed waterways also help prevent gully erosion in areas of concentrated flow. For example, they may be used to drain runoff from terraces and runoff water diversions. By intercepting runoff, grassed waterways slow erosion and minimize nutrient losses. The inputs for Waterways include:
Crop: This is the type of grass or vegetation that is used in the channel.
Width: This is the width of the grassed waterway, in feet, including both sides of the vegetated channel. This can be any number greater than 0.
Length: This is the total length of the grass water buffer.
Fraction of field treated by grass waterway: The fraction of the field that drains to the grass waterway. A number between 0.00 and 1.00.
Contour Buffer (Strip Farming)
Contour buffer strips are permanent, narrow bands of grasses/legumes planted on the contour (across or perpendicular to a slope) between wider strips of crops. Contour buffers trap sediment and enhance filtration of nutrients and pesticides by slowing down runoff that could enter the local surface waters. User input fields for contour buffers include:
Crop: This is the type of grass or vegetation that will be present in the buffer sections of the contour buffer.
Grass buffer Width: This is the width, in feet, of the buffer strips. It can be any number greater than 0. Buffer width, along with crop width, determine the number of buffer and crop strips in the field.
Crop strip Width: This is the width, in feet, of the strips of the main crop that was planted. It can be any number greater than 0. Crop width, along with buffer width, determine the number of buffer and crop strips in the field.
Land Leveling
Land leveling is used to reduce the slope on high soil slopes. By reducing the slope, the surface land is better able to retain water and soil, reducing erosion and increasing infiltration. The input for land leveling is slope reduction percentage.
Slope Reduction: This is the percent reduction in the slope of the soil. The number can be any percentage between 0% and 100%. The closer the slope is to 100, the more the slope is reduced.
Terrace System
A terrace system is a leveled section of a hill cultivated area, designed as a method of soil conservation to slow or prevent the rapid surface runoff of water. Terraces decrease hill slope-length, reduce formation of gullies, and intercept and conduct runoff to a safe outlet thereby reducing sediment content in runoff water. Often, in application the landscape is formed into multiple terraces, giving a stepped appearance. Terraces are simulated by reducing the practice factor (PEC). If you would like to apply a terrace system, click on the Select button.
Reservoir
Elevation at Emergency Spillway: This is the elevation at emergency spillway in feet.
Surface Area at Emergency Spillway: This is the total reservoir surface area, in feet, at emergency spillway elevation.
Volume at Emergency Spillway: This is the runoff volume from reservoir catchment area at emergency spillway elevation in inches.
Elevation at Principal Spillway: This is the elevation at principal spillway in feet.
Surface Area at Principal Spillway: This is the total reservoir surface area at principal spillway elevation in acres.
Volume at Principal Spillway: This is the Volume at principal spillway elevation in inches.
Initial Volume: This is the initial reservoir volume in inches.
Average Principal Spillway Release: This is the average principal spillway release rate in days.
Initial Sediment Concentration: This is the initial sediment concentration in reservoirs measured in ppm.
Normal Sediment Concentration: This is the normal sediment concentration in reservoirs measured in ppm.
Hydraulic conductivity of reservoir bottoms: This is the hydraulic conductivity of reservoir bottoms in mm/h.
Time Sediment to Return to Normal: This is the time required in days for the sediment in the reservoir to return to the normal concentrations following a runoff event.
Bulk Density of Sediment: This is the bulk density of sediment in t/m3.
Reference
* See USDA website: http://www.nrcs.usda.gov/wps/portal/nrcs/detailfull/national/technical/?&cid=nrcs143_026849 for more detailed term descriptions.